Ouverture :
6.100 €
Perf Ouverture :
-0.43 %
+ Haut :
6.220 €
+ Bas :
6.016 €
Clôture veille :
5.986 €
Volume :
592 739
Capi échangé :
+0.44 %
Capi :
818 M€
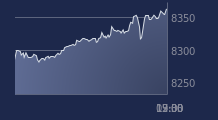
Graphique UBISOFT ENTERTAIN sur 5 jours
Cours UBISOFT ENTERTAIN sur 5 jours
| 06/01 | 07/01 | 08/01 | 09/01 | 09/01 | Date |
|---|---|---|---|---|---|
| 6.22 | 6.102 | 5.986 | 6.074 | 6.074 | Dernier |
| -1.83 % | -1.90 % | -1.90 % | +1.47 % | +1.47 % | Var. |
| 423892 | 587079 | 476287 | 592739 | 592739 | Volume |
| 6.286 | 6.192 | 6.1 | 6.1 | 6.1 | Ouv. |
| 6.35 | 6.192 | 6.18 | 6.22 | 6.22 | + Haut |
| 6.074 | 5.976 | 5.984 | 6.016 | 6.016 | + Bas |
| 6.2767 | 6.266 | 6.2607 | 6.2619 | 6.2619 | MM20 |
| 6.80676 | 6.7698 | 6.7256 | 6.68288 | 6.68288 | MM50 |
| 8.01954 | 7.98968 | 7.95606 | 7.92414 | 7.92414 | MM100 |
Performances historiques UBISOFT ENTERTAIN
| 5 jours | 1 mois | 1er janvier | 5 ans |
|---|---|---|---|
| -4.29 % | -0.30 % | -5.71 % | -92.39 % |
Court terme
Neutre
Moyen terme
Neutre
Long terme
Baissière
Portefeuille Trading
+335.10 % vs +68.21 % pour le CAC 40
Performance depuis le 28 mai 2008


