


chiffres clés
Ouverture :
10.660 €
Perf Ouverture :
-1.69 %
+ Haut :
10.660 €
+ Bas :
10.420 €
Clôture veille :
10.720 €
Volume :
221 078
Capi échangé :
+0.24 %
Capi :
984 M€
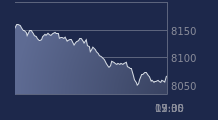
Graphique MERCIALYS sur 5 jours
Cours MERCIALYS sur 5 jours
| 15/09 | 16/09 | 17/09 | 18/09 | 21/09 | Date |
|---|---|---|---|---|---|
| 10.440(c) | 10.740(c) | 10.720(c) | 10.480(c) | - | Dernier |
| -0.76 % | +2.87 % | -0.19 % | -2.24 % | - | Var. |
| 210 751 | 215 528 | 153 098 | 221 078 | - | Volume |
| 10.480 | 10.460 | 10.760 | 10.660 | - | Ouv. |
| 10.520 | 10.780 | 10.800 | 10.660 | - | + Haut |
| 10.360 | 10.460 | 10.620 | 10.420 | - | + Bas |
| 11.002 | 10.971 | 10.939 | 10.898 | - | MM20 |
| 11.460 | 11.440 | 11.422 | 11.398 | - | MM50 |
| 11.609 | 11.591 | 11.574 | 11.555 | - | MM100 |
Performances historiques MERCIALYS
| 5 jours | 1 mois | 1er janvier | 5 ans |
|---|---|---|---|
| -0.57 % | -9.34 % | -5.07 % | +11.37 % |
Court terme
Baissière
Moyen terme
Baissière
Long terme
Baissière
Portefeuille Trading
+314.30 % vs +62.24 % pour le CAC 40
Performance depuis le 28 mai 2008