


chiffres clés
Ouverture :
116.000 €
Perf Ouverture :
-0.17 %
+ Haut :
116.600 €
+ Bas :
115.000 €
Clôture veille :
115.800 €
Volume :
2 812
Capi échangé :
+0.01 %
Capi :
4 150 M€
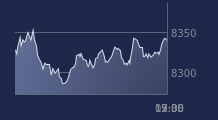
Graphique LDC sur 5 jours
Cours LDC sur 5 jours
| 13/07 | 14/07 | 15/07 | 16/07 | 17/07 | Date |
|---|---|---|---|---|---|
| 117.000(c) | 116.000(c) | 116.000(c) | 115.800(c) | 115.800(c) | Dernier |
| +0.17 % | -0.85 % | 0.00 % | -0.17 % | 0.00 % | Var. |
| 5 282 | 1 813 | 2 346 | 2 845 | 2 812 | Volume |
| 116.400 | 116.200 | 118.000 | 116.800 | 116.000 | Ouv. |
| 118.400 | 117.000 | 118.000 | 117.600 | 116.600 | + Haut |
| 115.600 | 115.200 | 115.200 | 115.600 | 115.000 | + Bas |
| 120.170 | 120.010 | 119.910 | 119.720 | 119.600 | MM20 |
| 117.920 | 117.988 | 118.032 | 118.060 | 118.076 | MM50 |
| 109.431 | 109.650 | 109.848 | 110.040 | 110.218 | MM100 |
Performances historiques LDC
| 5 jours | 1 mois | 1er janvier | 5 ans |
|---|---|---|---|
| -0.86 % | -2.85 % | +30.26 % | +125.95 % |
Court terme
Baissière
Moyen terme
Neutre
Long terme
Haussière
Portefeuille Trading
+318.20 % vs +67.75 % pour le CAC 40
Performance depuis le 28 mai 2008