


chiffres clés
Ouverture :
1 682.000 €
Perf Ouverture :
+0.98 %
+ Haut :
1 700.000 €
+ Bas :
1 674.000 €
Clôture veille :
1 683.500 €
Volume :
31 988
Capi échangé :
+0.03 %
Capi :
179 310 M€
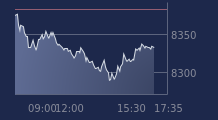
Graphique HERMES INTL sur 5 jours
Cours HERMES INTL sur 5 jours
| 10/07 | 13/07 | 14/07 | 15/07 | 16/07 | Date |
|---|---|---|---|---|---|
| 1641.500(c) | 1657.000(c) | 1644.500(c) | 1683.500(c) | 1697.000 | Dernier |
| +1.05 % | +0.94 % | -0.75 % | +2.37 % | +0.80 % | Var. |
| 91 607 | 78 345 | 67 741 | 80 387 | 31 606 | Volume |
| 1632.000 | 1640.000 | 1630.000 | 1680.500 | 1682.000 | Ouv. |
| 1646.000 | 1662.000 | 1649.000 | 1703.000 | 1700.000 | + Haut |
| 1624.000 | 1630.000 | 1610.500 | 1642.500 | 1674.000 | + Bas |
| 1648.320 | 1645.570 | 1640.320 | 1638.120 | 1634.820 | MM20 |
| 1630.680 | 1632.050 | 1633.180 | 1633.420 | 1633.320 | MM50 |
| 1713.780 | 1709.660 | 1705.710 | 1701.430 | 1697.330 | MM100 |
Performances historiques HERMES INTL
| 5 jours | 1 mois | 1er janvier | 5 ans |
|---|---|---|---|
| +4.56 % | -0.79 % | -19.96 % | +33.85 % |
Court terme
Neutre
Moyen terme
Neutre
Long terme
Neutre
Portefeuille Trading
+319.50 % vs +67.78 % pour le CAC 40
Performance depuis le 28 mai 2008