


chiffres clés
Ouverture :
43.320 €
Perf Ouverture :
+3.88 %
+ Haut :
45.200 €
+ Bas :
43.320 €
Clôture veille :
43.140 €
Volume :
142 765
Capi échangé :
+0.20 %
Capi :
3 293 M€
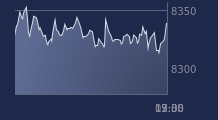
Graphique APERAM sur 5 jours
Cours APERAM sur 5 jours
| 06/07 | 07/07 | 08/07 | 09/07 | 10/07 | Date |
|---|---|---|---|---|---|
| 45.840(c) | 45.100(c) | 43.480(c) | 43.140(c) | 45.000(c) | Dernier |
| +0.75 % | -1.61 % | -3.59 % | -0.78 % | +4.31 % | Var. |
| 116 103 | 120 830 | 168 815 | 147 287 | 142 765 | Volume |
| 45.160 | 45.440 | 43.240 | 44.300 | 43.320 | Ouv. |
| 45.840 | 45.980 | 44.420 | 44.700 | 45.200 | + Haut |
| 44.860 | 45.100 | 42.100 | 42.640 | 43.320 | + Bas |
| 46.590 | 46.343 | 46.094 | 45.741 | 45.408 | MM20 |
| 47.846 | 47.926 | 47.964 | 47.994 | 47.987 | MM50 |
| 43.246 | 43.270 | 43.287 | 43.301 | 43.343 | MM100 |
Performances historiques APERAM
| 5 jours | 1 mois | 1er janvier | 5 ans |
|---|---|---|---|
| -1.10 % | -10.09 % | +27.70 % | -3.70 % |
Court terme
Neutre
Moyen terme
Baissière
Long terme
Neutre
Pas de conseil sur cette valeur
Portefeuille Trading
+319.20 % vs +67.75 % pour le CAC 40
Performance depuis le 28 mai 2008