


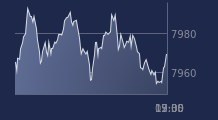
chiffres clés
Ouverture :
10.535 €
Perf Ouverture :
-1.47 %
+ Haut :
10.535 €
+ Bas :
10.360 €
Clôture veille :
10.510 €
Volume :
440 913
Capi échangé :
+0.17 %
Capi :
2 728 M€
Graphique AIR FRANCE-KLM sur 5 jours
Cours AIR FRANCE-KLM sur 5 jours
| 26/10 | 27/10 | 28/10 | 29/10 | 30/10 | Date |
|---|---|---|---|---|---|
| 10.250(c) | 10.370(c) | 10.285(c) | 10.510(c) | 10.380(c) | Dernier |
| +2.99 % | +1.17 % | -0.82 % | +2.19 % | -1.24 % | Var. |
| 1 237 190 | 729 902 | 505 040 | 594 631 | 440 913 | Volume |
| 10.075 | 10.275 | 10.450 | 10.285 | 10.535 | Ouv. |
| 10.425 | 10.420 | 10.465 | 10.565 | 10.535 | + Haut |
| 10.065 | 10.170 | 10.240 | 10.285 | 10.360 | + Bas |
| 10.807 | 10.736 | 10.668 | 10.626 | 10.578 | MM20 |
| 11.306 | 11.277 | 11.247 | 11.230 | 11.207 | MM50 |
| 11.913 | 11.906 | 11.899 | 11.894 | 11.880 | MM100 |
Performances historiques AIR FRANCE-KLM
| 5 jours | 1 mois | 1er janvier | 5 ans |
|---|---|---|---|
| +4.30 % | -12.07 % | -10.25 % | -49.43 % |
Court terme
Baissière
Moyen terme
Baissière
Long terme
Baissière
Portefeuille Trading
+317.50 % vs +60.31 % pour le CAC 40
Performance depuis le 28 mai 2008