


chiffres clés
Ouverture :
46.200 €
Perf Ouverture :
-0.32 %
+ Haut :
46.200 €
+ Bas :
45.850 €
Clôture veille :
46.550 €
Volume :
2 647
Capi échangé :
+0.01 %
Capi :
1 147 M€
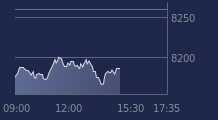
Graphique WAVESTONE sur 5 jours
Cours WAVESTONE sur 5 jours
| 07/04 | 08/04 | 09/04 | 10/04 | 13/04 | Date |
|---|---|---|---|---|---|
| 46.200(c) | 47.600(c) | 45.200(c) | 46.550(c) | 46.050 | Dernier |
| -1.91 % | +3.03 % | -5.04 % | +2.99 % | -1.07 % | Var. |
| 7 854 | 18 112 | 19 533 | 10 315 | 2 647 | Volume |
| 47.400 | 48.200 | 47.700 | 45.650 | 46.200 | Ouv. |
| 48.000 | 49.150 | 47.700 | 47.050 | 46.200 | + Haut |
| 46.150 | 47.250 | 45.100 | 45.650 | 45.850 | + Bas |
| 46.708 | 46.638 | 46.413 | 46.235 | 46.070 | MM20 |
| 49.434 | 49.176 | 48.844 | 48.539 | 48.280 | MM50 |
| 52.119 | 52.084 | 52.023 | 51.989 | 51.963 | MM100 |
Performances historiques WAVESTONE
| 5 jours | 1 mois | 1er janvier | 5 ans |
|---|---|---|---|
| -2.23 % | -6.69 % | -17.18 % | +28.63 % |
Court terme
Neutre
Moyen terme
Baissière
Long terme
Baissière
Portefeuille Trading
+332.70 % vs +64.70 % pour le CAC 40
Performance depuis le 28 mai 2008