


chiffres clés
Ouverture :
2.165 €
Perf Ouverture :
+4.85 %
+ Haut :
2.318 €
+ Bas :
2.152 €
Clôture veille :
2.179 €
Volume :
572 226
Capi échangé :
+0.30 %
Capi :
431 M€
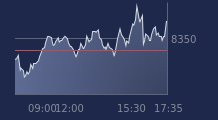
Graphique VALNEVA sur 5 jours
Cours VALNEVA sur 5 jours
| 08/07 | 09/07 | 10/07 | 13/07 | 14/07 | Date |
|---|---|---|---|---|---|
| 2.283(c) | 2.287(c) | 2.179(c) | 2.270(c) | - | Dernier |
| -0.09 % | +0.18 % | -4.72 % | +4.18 % | - | Var. |
| 340 101 | 144 492 | 603 158 | 572 226 | - | Volume |
| 2.260 | 2.280 | 2.287 | 2.165 | - | Ouv. |
| 2.334 | 2.290 | 2.294 | 2.318 | - | + Haut |
| 2.231 | 2.245 | 2.179 | 2.152 | - | + Bas |
| 2.274 | 2.278 | 2.273 | 2.272 | - | MM20 |
| 2.383 | 2.382 | 2.379 | 2.380 | - | MM50 |
| 3.018 | 2.997 | 2.973 | 2.949 | - | MM100 |
Performances historiques VALNEVA
| 5 jours | 1 mois | 1er janvier | 5 ans |
|---|---|---|---|
| -1.73 % | -0.70 % | -38.95 % | -79.71 % |
Court terme
Neutre
Moyen terme
Neutre
Long terme
Neutre
Portefeuille Trading
+320.20 % vs +68.27 % pour le CAC 40
Performance depuis le 28 mai 2008