


Ouverture :
-
Perf Ouverture :
-
+ Haut :
-
+ Bas :
-
Clôture veille :
21.000 €
Volume :
-
Capi échangé :
-
Capi :
339 M€
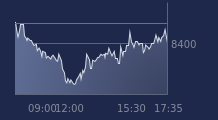
Graphique UNION FIN.FRANCE sur 5 jours
Cours UNION FIN.FRANCE sur 5 jours
| 17/06 | 18/06 | 19/06 | 22/06 | 23/06 | Date |
|---|---|---|---|---|---|
| - | - | - | - | - | Dernier |
| - | - | - | - | - | Var. |
| - | - | - | - | - | Volume |
| - | - | - | - | - | Ouv. |
| - | - | - | - | - | + Haut |
| - | - | - | - | - | + Bas |
| - | - | - | - | - | MM20 |
| - | - | - | - | - | MM50 |
| - | - | - | - | - | MM100 |
Performances historiques UNION FIN.FRANCE
| 5 jours | 1 mois | 1er janvier | 5 ans |
|---|---|---|---|
| -0.48 % | -0.95 % | -0.95 % | -33.44 % |
Court terme
Baissière
Moyen terme
Baissière
Long terme
Neutre
Pas de conseil sur cette valeur
Portefeuille Trading
+322.30 % vs +68.98 % pour le CAC 40
Performance depuis le 28 mai 2008