


chiffres clés
Ouverture :
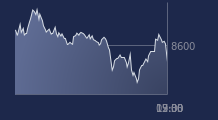
50.000 €
Perf Ouverture :
+2.96 %
+ Haut :
53.320 €
+ Bas :
48.080 €
Clôture veille :
53.380 €
Volume :
1 110 900
Capi échangé :
+1.86 %
Capi :
3 082 M€
Graphique TELEPERFORMANCE sur 5 jours
Cours TELEPERFORMANCE sur 5 jours
| 23/02 | 24/02 | 25/02 | 26/02 | 27/02 | Date |
|---|---|---|---|---|---|
| 50.220(c) | 50.880(c) | 50.340(c) | 53.380(c) | 51.480(c) | Dernier |
| -3.42 % | +1.31 % | -1.06 % | +6.04 % | -3.56 % | Var. |
| 279 755 | 363 206 | 288 830 | 484 769 | 1 110 900 | Volume |
| 51.980 | 49.940 | 50.800 | 50.200 | 50.000 | Ouv. |
| 52.600 | 51.220 | 51.540 | 54.600 | 53.320 | + Haut |
| 50.220 | 49.250 | 50.220 | 49.900 | 48.080 | + Bas |
| 52.535 | 52.338 | 52.116 | 52.126 | 51.970 | MM20 |
| 57.339 | 57.133 | 56.912 | 56.766 | 56.594 | MM50 |
| 59.313 | 59.186 | 59.049 | 58.949 | 58.822 | MM100 |
Performances historiques TELEPERFORMANCE
| 5 jours | 1 mois | 1er janvier | 5 ans |
|---|---|---|---|
| -1.00 % | -5.02 % | -16.75 % | -82.44 % |
Court terme
Baissière
Moyen terme
Baissière
Long terme
Baissière
Portefeuille Trading
+334.30 % vs +72.61 % pour le CAC 40
Performance depuis le 28 mai 2008