


chiffres clés
Ouverture :
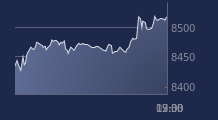
36.850 €
Perf Ouverture :
+0.27 %
+ Haut :
37.340 €
+ Bas :
36.060 €
Clôture veille :
36.490 €
Volume :
77 888
Capi échangé :
+0.22 %
Capi :
1 322 M€
Graphique SOITEC sur 5 jours
Cours SOITEC sur 5 jours
| 16/02 | 17/02 | 18/02 | 19/02 | 20/02 | Date |
|---|---|---|---|---|---|
| 36.890(c) | 37.110(c) | 37.210(c) | 36.490(c) | 36.950(c) | Dernier |
| -1.21 % | +0.60 % | +0.27 % | -1.93 % | +1.26 % | Var. |
| 113 991 | 106 754 | 144 462 | 76 722 | 77 888 | Volume |
| 37.650 | 36.600 | 37.310 | 37.200 | 36.850 | Ouv. |
| 37.680 | 37.630 | 38.390 | 37.280 | 37.340 | + Haut |
| 36.260 | 35.900 | 36.870 | 36.220 | 36.060 | + Bas |
| 30.396 | 30.880 | 31.330 | 31.730 | 32.200 | MM20 |
| 27.495 | 27.712 | 27.914 | 28.117 | 28.333 | MM50 |
| 32.309 | 32.297 | 32.289 | 32.271 | 32.253 | MM100 |
Performances historiques SOITEC
| 5 jours | 1 mois | 1er janvier | 5 ans |
|---|---|---|---|
| -1.04 % | +34.61 % | +59.34 % | -80.62 % |
Court terme
Haussière
Moyen terme
Haussière
Long terme
Neutre
Portefeuille Trading
+335.80 % vs +71.30 % pour le CAC 40
Performance depuis le 28 mai 2008