


chiffres clés
Ouverture :
0.270 €
Perf Ouverture :
+7.04 %
+ Haut :
0.290 €
+ Bas :
0.270 €
Clôture veille :
0.270 €
Volume :
31 545
Capi échangé :
+0.06 %
Capi :
15 M€
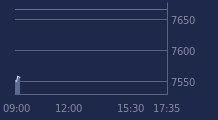
Graphique OREGE sur 5 jours
Cours OREGE sur 5 jours
| 17/03 | 18/03 | 19/03 | 20/03 | 23/03 | Date |
|---|---|---|---|---|---|
| 0.246(c) | 0.231(c) | 0.219(c) | 0.270(c) | 0.289 | Dernier |
| -3.15 % | -6.10 % | -5.19 % | +23.29 % | +7.04 % | Var. |
| 8 812 | 6 338 | 10 119 | 60 826 | 31 545 | Volume |
| 0.253 | 0.245 | 0.227 | 0.211 | 0.270 | Ouv. |
| 0.253 | 0.245 | 0.227 | 0.271 | 0.290 | + Haut |
| 0.235 | 0.231 | 0.215 | 0.211 | 0.270 | + Bas |
| 0.257 | 0.256 | 0.255 | 0.256 | 0.257 | MM20 |
| 0.268 | 0.266 | 0.265 | 0.264 | 0.264 | MM50 |
| 0.280 | 0.279 | 0.279 | 0.278 | 0.278 | MM100 |
Performances historiques OREGE
| 5 jours | 1 mois | 1er janvier | 5 ans |
|---|---|---|---|
| +13.78 % | +14.23 % | -2.69 % | -81.71 % |
Court terme
Haussière
Moyen terme
Neutre
Long terme
Baissière
Pas de conseil sur cette valeur
Portefeuille Trading
+336.60 % vs +51.82 % pour le CAC 40
Performance depuis le 28 mai 2008