


Ouverture :
-
Perf Ouverture :
-
+ Haut :
-
+ Bas :
-
Clôture veille :
19.100 €
Volume :
-
Capi échangé :
-
Capi :
30 M€
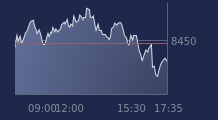
Graphique ODYSSEE TECHNOLGIES sur 5 jours
Cours ODYSSEE TECHNOLGIES sur 5 jours
| 12/06 | 15/06 | 16/06 | 17/06 | 18/06 | Date |
|---|---|---|---|---|---|
| 19.240(c) | 20.000(c) | 19.100(c) | 18.620(c) | - | Dernier |
| -1.03 % | +3.95 % | -4.50 % | -2.51 % | - | Var. |
| 2 196 | 1 283 | 1 735 | 1 017 | - | Volume |
| 19.100 | 19.240 | 19.800 | 19.000 | - | Ouv. |
| 19.420 | 20.300 | 19.980 | 19.000 | - | + Haut |
| 19.000 | 19.240 | 19.100 | 18.520 | - | + Bas |
| 21.239 | 21.164 | 21.009 | 20.833 | - | MM20 |
| 22.805 | 22.665 | 22.530 | 22.386 | - | MM50 |
| 25.989 | 25.865 | 25.736 | 25.608 | - | MM100 |
Performances historiques ODYSSEE TECHNOLGIES
| 5 jours | 1 mois | 1er janvier | 5 ans |
|---|---|---|---|
| -7.82 % | -16.31 % | -26.26 % | 0.00 % |
Court terme
Baissière
Moyen terme
Baissière
Long terme
Baissière
Pas de conseil sur cette valeur
Portefeuille Trading
+324.30 % vs +69.60 % pour le CAC 40
Performance depuis le 28 mai 2008