


chiffres clés
Ouverture :
4 240.58
+ Haut :
4 240.58
+ Bas :
4 240.58
Perf Ouverture :
0.00 %
Clôture veille :
4 240.58
Volume :
0
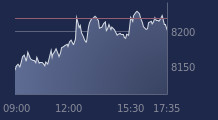
Graphique NEXT BIOTECH sur 5 jours
Cours NEXT BIOTECH sur 5 jours
| 03/06 | 04/06 | 05/06 | 08/06 | 09/06 | Date |
|---|---|---|---|---|---|
| 3857.62(c) | 4074.88(c) | 4240.58(c) | - | - | Dernier |
| +0.96 % | +5.63 % | +4.07 % | - | - | Var. |
| 0 | 0 | 0 | - | - | Volume |
| 3857.62 | 4074.88 | 4240.58 | - | - | Ouv. |
| 3857.62 | 4074.88 | 4240.58 | - | - | + Haut |
| 3857.62 | 4074.88 | 4240.58 | - | - | + Bas |
| 4074.73 | 4089.71 | 4105.04 | - | - | MM20 |
| 3973.04 | 3988.00 | 4003.64 | - | - | MM50 |
| 3975.27 | 3977.75 | 3981.35 | - | - | MM100 |
Performances historiques NEXT BIOTECH
| 5 jours | 1 mois | 1er janvier | 5 ans |
|---|---|---|---|
| +0.88 % | +6.05 % | +1.80 % | +70.29 % |
Pas de news sur cette valeur
Pas de conseil sur cette valeur
Portefeuille Trading
+325.00 % vs +64.94 % pour le CAC 40
Performance depuis le 28 mai 2008