


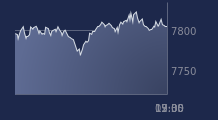
chiffres clés
Ouverture :
33.280 €
Perf Ouverture :
+0.39 %
+ Haut :
33.590 €
+ Bas :
33.170 €
Clôture veille :
33.080 €
Volume :
1 189 490
Capi échangé :
+0.17 %
Capi :
22 973 M€
Graphique MICHELIN sur 5 jours
Cours MICHELIN sur 5 jours
| 05/10 | 06/10 | 07/10 | 08/10 | 09/10 | Date |
|---|---|---|---|---|---|
| 33.310(c) | 33.700(c) | 33.570(c) | 33.080(c) | 33.410(c) | Dernier |
| +0.88 % | +1.17 % | -0.39 % | -1.46 % | +1.00 % | Var. |
| 1 125 720 | 1 290 190 | 1 426 240 | 1 370 680 | 1 189 490 | Volume |
| 32.940 | 33.420 | 33.530 | 33.370 | 33.280 | Ouv. |
| 33.600 | 33.700 | 34.040 | 33.370 | 33.590 | + Haut |
| 32.900 | 33.350 | 33.480 | 32.820 | 33.170 | + Bas |
| 33.537 | 33.489 | 33.480 | 33.458 | 33.455 | MM20 |
| 34.179 | 34.164 | 34.149 | 34.120 | 34.089 | MM50 |
| 33.712 | 33.741 | 33.765 | 33.784 | 33.803 | MM100 |
Performances historiques MICHELIN
| 5 jours | 1 mois | 1er janvier | 5 ans |
|---|---|---|---|
| +1.18 % | -3.61 % | +18.01 % | +0.10 % |
Court terme
Baissière
Moyen terme
Baissière
Long terme
Neutre
Portefeuille Trading
+315.70 % vs +56.97 % pour le CAC 40
Performance depuis le 28 mai 2008