


chiffres clés
Ouverture :
7.9050 €
+ Haut :
7.9370 €
+ Bas :
7.8910 €
Perf Ouverture :
+0.40 %
Clôture veille :
7.7660 €
Volume :
97 830
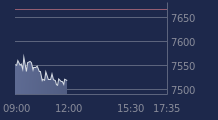
Graphique LYXOR ETF SX50 DS sur 5 jours
Cours LYXOR ETF SX50 DS sur 5 jours
| 17/03 | 18/03 | 19/03 | 20/03 | 23/03 | Date |
|---|---|---|---|---|---|
| 7.4090(c) | 7.4670(c) | 7.6190(c) | 7.7660(c) | 7.9370 | Dernier |
| -0.42 % | +0.78 % | +2.04 % | +1.93 % | +2.20 % | Var. |
| 7.4680 | 7.3590 | 7.5630 | 7.5350 | 7.9050 | Ouv. |
| 7.4700 | 7.4830 | 7.6610 | 7.7660 | 7.9370 | + Haut |
| 7.3850 | 7.3400 | 7.5630 | 7.5190 | 7.8910 | + Bas |
| 7.2301 | 7.2530 | 7.2816 | 7.3207 | 7.3681 | MM20 |
| 7.1821 | 7.1874 | 7.1953 | 7.2081 | 7.2246 | MM50 |
| 7.3318 | 7.3313 | 7.3328 | 7.3358 | 7.3405 | MM100 |
Produit
Trackers
Type de produit
SHORT EUROSTOXX 50
Sous-jacent
DOW JONES EURO S…
Type de sous-jacent
-
Emetteur
SGAM
Portefeuille Trading
+336.60 % vs +51.20 % pour le CAC 40
Performance depuis le 28 mai 2008