


chiffres clés
Ouverture :
53.100 €
Perf Ouverture :
+0.47 %
+ Haut :
53.750 €
+ Bas :
53.100 €
Clôture veille :
53.100 €
Volume :
85 813
Capi échangé :
+0.08 %
Capi :
5 955 M€
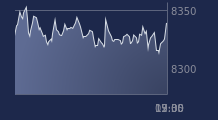
Graphique COVIVIO sur 5 jours
Cours COVIVIO sur 5 jours
| 06/07 | 07/07 | 08/07 | 09/07 | 10/07 | Date |
|---|---|---|---|---|---|
| 53.550(c) | 54.200(c) | 52.500(c) | 53.100(c) | 53.350(c) | Dernier |
| -1.20 % | +1.21 % | -3.14 % | +1.14 % | +0.47 % | Var. |
| 141 149 | 127 199 | 183 985 | 133 387 | 85 813 | Volume |
| 54.150 | 54.000 | 53.900 | 52.800 | 53.100 | Ouv. |
| 54.400 | 54.800 | 53.900 | 53.350 | 53.750 | + Haut |
| 53.550 | 53.800 | 51.850 | 52.500 | 53.100 | + Bas |
| 54.035 | 54.090 | 54.018 | 53.970 | 53.885 | MM20 |
| 54.444 | 54.395 | 54.318 | 54.262 | 54.205 | MM50 |
| 55.407 | 55.405 | 55.389 | 55.375 | 55.342 | MM100 |
Performances historiques COVIVIO
| 5 jours | 1 mois | 1er janvier | 5 ans |
|---|---|---|---|
| -1.57 % | +0.47 % | -5.83 % | -31.16 % |
Court terme
Baissière
Moyen terme
Baissière
Long terme
Baissière
Portefeuille Trading
+319.20 % vs +67.75 % pour le CAC 40
Performance depuis le 28 mai 2008