


chiffres clés
Ouverture :
6.7230 €
+ Haut :
6.7800 €
+ Bas :
6.7230 €
Perf Ouverture :
+0.62 %
Clôture veille :
6.7000 €
Volume :
42 064
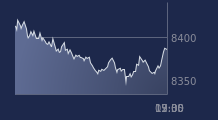
Graphique LYXOR ETF SX50 DS sur 5 jours
Cours LYXOR ETF SX50 DS sur 5 jours
| 22/06 | 23/06 | 24/06 | 25/06 | 26/06 | Date |
|---|---|---|---|---|---|
| 6.6410(c) | 6.7290(c) | 6.7590(c) | 6.7000(c) | 6.7650(c) | Dernier |
| -0.06 % | +1.33 % | +0.45 % | -0.87 % | +0.97 % | Var. |
| 6.6470 | 6.7240 | 6.7390 | 6.7240 | 6.7230 | Ouv. |
| 6.6640 | 6.7500 | 6.7600 | 6.7240 | 6.7800 | + Haut |
| 6.6300 | 6.7100 | 6.7390 | 6.6810 | 6.7230 | + Bas |
| 6.8334 | 6.8254 | 6.8187 | 6.8072 | 6.8005 | MM20 |
| 7.0174 | 7.0079 | 7.0010 | 6.9919 | 6.9842 | MM50 |
| 7.1608 | 7.1555 | 7.1514 | 7.1472 | 7.1443 | MM100 |
Produit
Trackers
Type de produit
SHORT EUROSTOXX 50
Sous-jacent
DOW JONES EURO S…
Type de sous-jacent
-
Emetteur
SGAM
Portefeuille Trading
+322.00 % vs +68.67 % pour le CAC 40
Performance depuis le 28 mai 2008