


chiffres clés
Ouverture :
247.1000 €
+ Haut :
247.1000 €
+ Bas :
239.3000 €
Perf Ouverture :
-2.39 %
Clôture veille :
245.6000 €
Volume :
8 895
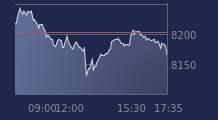
Graphique LYXOR ETF LEVDAX sur 5 jours
Cours LYXOR ETF LEVDAX sur 5 jours
| 04/06 | 05/06 | 08/06 | 09/06 | 10/06 | Date |
|---|---|---|---|---|---|
| 255.8000(c) | 253.6500(c) | 250.6500(c) | 245.6000(c) | 241.2000(c) | Dernier |
| +0.81 % | -0.84 % | -1.18 % | -2.01 % | -1.79 % | Var. |
| 254.6000 | 255.4000 | 246.3500 | 249.4000 | 247.1000 | Ouv. |
| 257.4500 | 257.5000 | 251.8000 | 253.1500 | 247.1000 | + Haut |
| 254.6000 | 253.6500 | 246.0500 | 245.6000 | 239.3000 | + Bas |
| 252.0230 | 252.4730 | 252.7230 | 253.1150 | 253.1250 | MM20 |
| 242.4770 | 243.2770 | 243.8820 | 244.4970 | 245.1380 | MM50 |
| 248.6150 | 248.3940 | 248.1760 | 247.8860 | 247.5740 | MM100 |
Produit
Trackers
Type de produit
Leveraged
Sous-jacent
LEVDAX
Type de sous-jacent
-
Emetteur
LYXOR ASSET MANAGEMENT
Portefeuille Trading
+323.90 % vs +64.19 % pour le CAC 40
Performance depuis le 28 mai 2008