


chiffres clés
Ouverture :
44.7800 €
+ Haut :
44.9600 €
+ Bas :
44.3750 €
Perf Ouverture :
-0.18 %
Clôture veille :
44.5450 €
Volume :
88 269
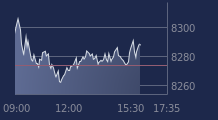
Graphique LYXOR ETF LEV CAC sur 5 jours
Cours LYXOR ETF LEV CAC sur 5 jours
| 03/02 | 04/02 | 05/02 | 06/02 | 09/02 | Date |
|---|---|---|---|---|---|
| 43.5350(c) | 44.4300(c) | 44.1650(c) | 44.5450(c) | 44.7000 | Dernier |
| -0.08 % | +2.06 % | -0.60 % | +0.86 % | +0.35 % | Var. |
| 43.9600 | 43.8600 | 44.7600 | 43.8950 | 44.7800 | Ouv. |
| 44.1550 | 44.8200 | 44.9800 | 44.6900 | 44.9600 | + Haut |
| 43.0200 | 43.8450 | 43.6750 | 43.4700 | 44.3750 | + Bas |
| 43.8115 | 43.8165 | 43.8058 | 43.7510 | 43.7055 | MM20 |
| 43.3104 | 43.3648 | 43.4174 | 43.4646 | 43.5011 | MM50 |
| 42.8320 | 42.8741 | 42.9063 | 42.9508 | 42.9999 | MM100 |
Produit
Trackers
Type de produit
Leveraged
Sous-jacent
CAC 40 LEVERAGE
Type de sous-jacent
-
Emetteur
LYXOR ASSET MANAGEMENT
Portefeuille Trading
+336.70 % vs +66.82 % pour le CAC 40
Performance depuis le 28 mai 2008