


chiffres clés
Ouverture :
43.7550 €
+ Haut :
44.1000 €
+ Bas :
43.4000 €
Perf Ouverture :
-0.22 %
Clôture veille :
43.2800 €
Volume :
167 231
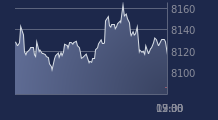
Graphique LYXOR ETF LEV CAC sur 5 jours
Cours LYXOR ETF LEV CAC sur 5 jours
| 18/05 | 19/05 | 20/05 | 21/05 | 22/05 | Date |
|---|---|---|---|---|---|
| 42.3000(c) | 42.1900(c) | 43.6550(c) | 43.2800(c) | 43.6600(c) | Dernier |
| +1.45 % | -0.26 % | +3.47 % | -0.86 % | +0.88 % | Var. |
| 41.0600 | 42.4850 | 42.0950 | 43.5900 | 43.7550 | Ouv. |
| 42.5150 | 43.2000 | 44.2700 | 44.0000 | 44.1000 | + Haut |
| 40.8900 | 42.0800 | 42.0300 | 42.9800 | 43.4000 | + Bas |
| 42.8888 | 42.7680 | 42.7635 | 42.7802 | 42.7792 | MM20 |
| 41.9177 | 41.9234 | 41.9689 | 42.0234 | 42.0565 | MM50 |
| 43.2057 | 43.1964 | 43.2038 | 43.2052 | 43.2119 | MM100 |
Produit
Trackers
Type de produit
Leveraged
Sous-jacent
CAC 40 LEVERAGE
Type de sous-jacent
-
Emetteur
LYXOR ASSET MANAGEMENT
Portefeuille Trading
+330.40 % vs +63.26 % pour le CAC 40
Performance depuis le 28 mai 2008