


chiffres clés
Ouverture :
44.6710 €
+ Haut :
44.7610 €
+ Bas :
44.6240 €
Perf Ouverture :
+0.20 %
Clôture veille :
45.1380 €
Volume :
77
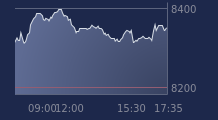
Graphique LYXOR ETF BUND DDS sur 5 jours
Cours LYXOR ETF BUND DDS sur 5 jours
| 08/06 | 09/06 | 10/06 | 11/06 | 12/06 | Date |
|---|---|---|---|---|---|
| 45.1860(c) | 45.0960(c) | 45.2380(c) | 45.1380(c) | 44.7610(c) | Dernier |
| +0.31 % | -0.20 % | +0.31 % | -0.22 % | -0.84 % | Var. |
| 45.1950 | 45.1280 | 45.0750 | 45.2990 | 44.6710 | Ouv. |
| 45.1950 | 45.1280 | 45.3230 | 45.2990 | 44.7610 | + Haut |
| 45.0560 | 45.0960 | 45.0750 | 45.1380 | 44.6240 | + Bas |
| 45.0710 | 45.0536 | 45.0372 | 45.0252 | 44.9823 | MM20 |
| 45.0379 | 45.0324 | 45.0235 | 45.0230 | 45.0197 | MM50 |
| 44.3804 | 44.3961 | 44.4116 | 44.4260 | 44.4337 | MM100 |
Produit
Trackers
Type de produit
Short
Sous-jacent
SGI DAILY DOUBLE…
Type de sous-jacent
-
Emetteur
LYXOR INTERNATIONAL ASSET MANAGEMENT
Portefeuille Trading
+325.40 % vs +67.99 % pour le CAC 40
Performance depuis le 28 mai 2008