


chiffres clés
Ouverture :
2.2010 €
+ Haut :
2.2065 €
+ Bas :
2.1630 €
Perf Ouverture :
-1.52 %
Clôture veille :
2.2330 €
Volume :
480 677
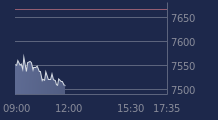
Graphique LYXOR ETF ATHEX 20 sur 5 jours
Cours LYXOR ETF ATHEX 20 sur 5 jours
| 17/03 | 18/03 | 19/03 | 20/03 | 23/03 | Date |
|---|---|---|---|---|---|
| 2.3345(c) | 2.3185(c) | 2.2640(c) | 2.2330(c) | 2.1675 | Dernier |
| +0.21 % | -0.69 % | -2.35 % | -1.37 % | -2.93 % | Var. |
| 2.3500 | 2.3435 | 2.2900 | 2.2625 | 2.2010 | Ouv. |
| 2.3500 | 2.3875 | 2.3025 | 2.2990 | 2.2065 | + Haut |
| 2.2955 | 2.3155 | 2.2500 | 2.2260 | 2.1630 | + Bas |
| 2.4203 | 2.4076 | 2.3944 | 2.3796 | 2.3620 | MM20 |
| 2.4824 | 2.4822 | 2.4792 | 2.4754 | 2.4701 | MM50 |
| 2.3822 | 2.3830 | 2.3834 | 2.3835 | 2.3828 | MM100 |
Produit
Trackers
Type de produit
Grèce
Sous-jacent
MSCI GREECE
Type de sous-jacent
-
Emetteur
LYXOR ASSET MANAGEMENT
Portefeuille Trading
+336.60 % vs +51.31 % pour le CAC 40
Performance depuis le 28 mai 2008