


chiffres clés
Ouverture :
2.8155 €
+ Haut :
2.8445 €
+ Bas :
2.8055 €
Perf Ouverture :
+0.76 %
Clôture veille :
2.7990 €
Volume :
131 640
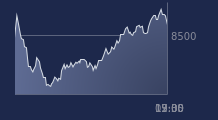
Graphique LYXOR ETF ATHEX 20 sur 5 jours
Cours LYXOR ETF ATHEX 20 sur 5 jours
| 29/06 | 30/06 | 01/07 | 02/07 | 03/07 | Date |
|---|---|---|---|---|---|
| 2.7400(c) | 2.7355(c) | 2.7700(c) | 2.7990(c) | 2.8370(c) | Dernier |
| +1.01 % | -0.16 % | +1.26 % | +1.05 % | +1.36 % | Var. |
| 2.7415 | 2.7605 | 2.7415 | 2.7685 | 2.8155 | Ouv. |
| 2.7515 | 2.7605 | 2.7795 | 2.8165 | 2.8445 | + Haut |
| 2.7200 | 2.7300 | 2.7290 | 2.7685 | 2.8055 | + Bas |
| 2.6723 | 2.6796 | 2.6893 | 2.7013 | 2.7146 | MM20 |
| 2.5596 | 2.5645 | 2.5700 | 2.5767 | 2.5841 | MM50 |
| 2.4942 | 2.4955 | 2.4968 | 2.4989 | 2.5012 | MM100 |
Produit
Trackers
Type de produit
Grèce
Sous-jacent
MSCI GREECE
Type de sous-jacent
-
Emetteur
LYXOR ASSET MANAGEMENT
Portefeuille Trading
+320.20 % vs +71.15 % pour le CAC 40
Performance depuis le 28 mai 2008