


chiffres clés
Ouverture :
5.800 €
Perf Ouverture :
-0.09 %
+ Haut :
5.800 €
+ Bas :
5.450 €
Clôture veille :
5.800 €
Volume :
3 322
Capi échangé :
+0.05 %
Capi :
37 M€
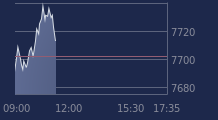
Graphique LIGHTON sur 5 jours
Cours LIGHTON sur 5 jours
| 24/03 | 25/03 | 26/03 | 27/03 | 30/03 | Date |
|---|---|---|---|---|---|
| 5.140(c) | 5.210(c) | 5.560(c) | 5.800(c) | 5.795 | Dernier |
| -2.65 % | +1.36 % | +6.72 % | +4.32 % | -0.09 % | Var. |
| 3 870 | 4 965 | 7 314 | 14 277 | 3 322 | Volume |
| 5.350 | 5.250 | 5.400 | 5.550 | 5.800 | Ouv. |
| 5.485 | 5.425 | 5.600 | 6.000 | 5.800 | + Haut |
| 5.140 | 5.210 | 5.300 | 5.340 | 5.450 | + Bas |
| 5.496 | 5.479 | 5.482 | 5.500 | 5.524 | MM20 |
| 5.705 | 5.699 | 5.704 | 5.709 | 5.712 | MM50 |
| 5.799 | 5.777 | 5.761 | 5.751 | 5.743 | MM100 |
Performances historiques LIGHTON
| 5 jours | 1 mois | 1er janvier | 5 ans |
|---|---|---|---|
| +9.75 % | +6.72 % | +15.44 % | 0.00 % |
Court terme
Haussière
Moyen terme
Haussière
Long terme
Neutre
Pas de conseil sur cette valeur
Portefeuille Trading
+333.80 % vs +55.16 % pour le CAC 40
Performance depuis le 28 mai 2008