


Ouverture :
-
Perf Ouverture :
-
+ Haut :
-
+ Bas :
-
Clôture veille :
21.900 €
Volume :
-
Capi échangé :
-
Capi :
469 M€
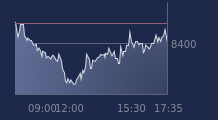
Graphique JACQUET METALS sur 5 jours
Cours JACQUET METALS sur 5 jours
| 17/06 | 18/06 | 19/06 | 22/06 | 23/06 | Date |
|---|---|---|---|---|---|
| 24.000(c) | 23.550(c) | 21.900(c) | 21.800(c) | - | Dernier |
| +1.69 % | -1.87 % | -7.01 % | -0.46 % | - | Var. |
| 7 820 | 15 904 | 4 286 | 2 858 | - | Volume |
| 23.450 | 24.000 | 23.550 | 21.850 | - | Ouv. |
| 24.050 | 24.200 | 23.550 | 21.850 | - | + Haut |
| 23.450 | 23.550 | 21.900 | 21.550 | - | + Bas |
| 22.143 | 22.258 | 22.300 | 22.340 | - | MM20 |
| 22.236 | 22.278 | 22.292 | 22.270 | - | MM50 |
| 22.375 | 22.380 | 22.366 | 22.351 | - | MM100 |
Performances historiques JACQUET METALS
| 5 jours | 1 mois | 1er janvier | 5 ans |
|---|---|---|---|
| -5.83 % | +2.59 % | +9.55 % | +8.19 % |
Court terme
Neutre
Moyen terme
Neutre
Long terme
Baissière
Portefeuille Trading
+322.30 % vs +68.98 % pour le CAC 40
Performance depuis le 28 mai 2008