


chiffres clés
Ouverture :
109.3000 €
+ Haut :
109.3500 €
+ Bas :
108.9000 €
Perf Ouverture :
-0.33 %
Clôture veille :
109.8600 €
Volume :
390
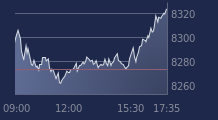
Graphique ISHARES US T 1-3 sur 5 jours
Cours ISHARES US T 1-3 sur 5 jours
| 04/02 | 05/02 | 06/02 | 09/02 | 10/02 | Date |
|---|---|---|---|---|---|
| 109.7800(c) | 110.0000(c) | 109.8600(c) | 108.9400(c) | - | Dernier |
| +0.03 % | +0.20 % | -0.13 % | -0.84 % | - | Var. |
| 109.5000 | 109.7600 | 110.0200 | 109.3000 | - | Ouv. |
| 109.8000 | 110.0000 | 110.0400 | 109.3500 | - | + Haut |
| 109.4200 | 109.7400 | 109.8600 | 108.9000 | - | + Bas |
| 110.0400 | 110.0010 | 109.9360 | 109.8480 | - | MM20 |
| 110.2360 | 110.2010 | 110.1730 | 110.1250 | - | MM50 |
| 110.1740 | 110.1870 | 110.2060 | 110.2160 | - | MM100 |
Produit
Trackers
Type de produit
Government Bonds
Sous-jacent
BARCLAYS US TREA…
Type de sous-jacent
-
Emetteur
BARCLAYS GLOBAL INVESTORS
Portefeuille Trading
+336.50 % vs +67.43 % pour le CAC 40
Performance depuis le 28 mai 2008