


chiffres clés
Ouverture :
58.2940 €
+ Haut :
58.3680 €
+ Bas :
57.8000 €
Perf Ouverture :
+0.12 %
Clôture veille :
58.1700 €
Volume :
17 177
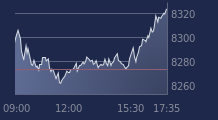
Graphique ISHARES S&P 500 sur 5 jours
Cours ISHARES S&P 500 sur 5 jours
| 04/02 | 05/02 | 06/02 | 09/02 | 10/02 | Date |
|---|---|---|---|---|---|
| 58.2110(c) | 57.6800(c) | 58.1700(c) | 58.3650(c) | - | Dernier |
| -0.44 % | -0.91 % | +0.85 % | +0.34 % | - | Var. |
| 58.3670 | 58.1780 | 57.3050 | 58.2940 | - | Ouv. |
| 58.5500 | 58.2810 | 58.1750 | 58.3680 | - | + Haut |
| 58.1000 | 57.3000 | 57.3000 | 57.8000 | - | + Bas |
| 58.7461 | 58.6742 | 58.6071 | 58.5530 | - | MM20 |
| 58.5118 | 58.5067 | 58.5109 | 58.5054 | - | MM50 |
| 57.9783 | 57.9958 | 58.0222 | 58.0511 | - | MM100 |
Produit
Trackers
Type de produit
Regions
Sous-jacent
Type de sous-jacent
-
Emetteur
BARCLAYS GLOBAL INVESTORS
Portefeuille Trading
+336.50 % vs +67.43 % pour le CAC 40
Performance depuis le 28 mai 2008