


chiffres clés
Ouverture :
20.3000 €
+ Haut :
20.4500 €
+ Bas :
20.2500 €
Perf Ouverture :
+0.74 %
Clôture veille :
20.6100 €
Volume :
99 397
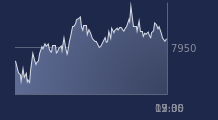
Graphique ISHARES LATIN AM sur 5 jours
Cours ISHARES LATIN AM sur 5 jours
| 12/10 | 13/10 | 14/10 | 15/10 | 16/10 | Date |
|---|---|---|---|---|---|
| 21.0000(c) | 20.7700(c) | 20.5950(c) | 20.6100(c) | 20.4500(c) | Dernier |
| +1.47 % | -1.10 % | -0.84 % | +0.07 % | -0.78 % | Var. |
| 20.8150 | 20.9350 | 20.7600 | 20.3850 | 20.3000 | Ouv. |
| 21.0000 | 21.0700 | 20.7600 | 20.6100 | 20.4500 | + Haut |
| 20.7900 | 20.5700 | 20.4350 | 20.2150 | 20.2500 | + Bas |
| 19.2020 | 19.3046 | 19.4042 | 19.4974 | 19.5918 | MM20 |
| 18.6404 | 18.6853 | 18.7268 | 18.7702 | 18.8149 | MM50 |
| 18.2787 | 18.3063 | 18.3308 | 18.3568 | 18.3837 | MM100 |
Produit
Trackers
Type de produit
Regions
Sous-jacent
MSCI EM LATIN AM…
Type de sous-jacent
-
Emetteur
BARCLAYS GLOBAL INVESTORS
Portefeuille Trading
+315.30 % vs +60.06 % pour le CAC 40
Performance depuis le 28 mai 2008