


chiffres clés
Ouverture :
24.6150 €
+ Haut :
24.7350 €
+ Bas :
24.5400 €
Perf Ouverture :
+0.49 %
Clôture veille :
24.5850 €
Volume :
38 381
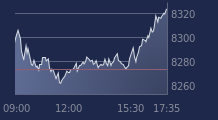
Graphique ISHARES ESTOXX DIV sur 5 jours
Cours ISHARES ESTOXX DIV sur 5 jours
| 04/02 | 05/02 | 06/02 | 09/02 | 10/02 | Date |
|---|---|---|---|---|---|
| 24.7900(c) | 24.4150(c) | 24.5850(c) | 24.7350(c) | - | Dernier |
| +1.06 % | -1.51 % | +0.70 % | +0.61 % | - | Var. |
| 24.5550 | 24.7050 | 24.3800 | 24.6150 | - | Ouv. |
| 24.8850 | 24.7050 | 24.6300 | 24.7350 | - | + Haut |
| 24.5550 | 24.3350 | 24.3650 | 24.5400 | - | + Bas |
| 24.0147 | 24.0400 | 24.0695 | 24.1088 | - | MM20 |
| 23.6649 | 23.7020 | 23.7372 | 23.7715 | - | MM50 |
| 23.0469 | 23.0672 | 23.0924 | 23.1195 | - | MM100 |
Produit
Trackers
Type de produit
Select Dividend
Sous-jacent
DOW JONES EURO S…
Type de sous-jacent
-
Emetteur
BARCLAYS GLOBAL INVESTORS
Portefeuille Trading
+336.50 % vs +67.43 % pour le CAC 40
Performance depuis le 28 mai 2008