


chiffres clés
Ouverture :
88.6400 €
+ Haut :
88.6400 €
+ Bas :
88.2000 €
Perf Ouverture :
-0.50 %
Clôture veille :
89.1200 €
Volume :
45
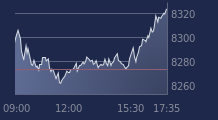
Graphique IS USD HEDGED CB sur 5 jours
Cours IS USD HEDGED CB sur 5 jours
| 04/02 | 05/02 | 06/02 | 09/02 | 10/02 | Date |
|---|---|---|---|---|---|
| 89.2000(c) | 88.9800(c) | 89.1200(c) | 88.2000(c) | - | Dernier |
| -0.36 % | -0.25 % | +0.16 % | -1.03 % | - | Var. |
| 89.0200 | 89.2300 | 89.1200 | 88.6400 | - | Ouv. |
| 89.2000 | 89.3000 | 89.1200 | 88.6400 | - | + Haut |
| 89.0200 | 88.9800 | 89.1200 | 88.2000 | - | + Bas |
| 89.4110 | 89.3810 | 89.3430 | 89.2705 | - | MM20 |
| 89.5884 | 89.5554 | 89.5210 | 89.4758 | - | MM50 |
| 89.7959 | 89.7946 | 89.7950 | 89.7920 | - | MM100 |
Produit
Trackers
Type de produit
-
Sous-jacent
Type de sous-jacent
-
Emetteur
-
Portefeuille Trading
+336.50 % vs +67.43 % pour le CAC 40
Performance depuis le 28 mai 2008