


chiffres clés
Ouverture :
101.0400 €
+ Haut :
101.1900 €
+ Bas :
101.0400 €
Perf Ouverture :
+0.10 %
Clôture veille :
101.1400 €
Volume :
7 057
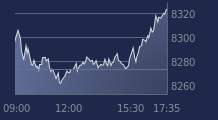
Graphique IS EURO ULTRASHORT sur 5 jours
Cours IS EURO ULTRASHORT sur 5 jours
| 04/02 | 05/02 | 06/02 | 09/02 | 10/02 | Date |
|---|---|---|---|---|---|
| 101.1200(c) | 101.1000(c) | 101.1400(c) | 101.1400(c) | - | Dernier |
| +0.03 % | -0.02 % | +0.04 % | 0.00 % | - | Var. |
| 101.1100 | 101.1000 | 101.0900 | 101.0400 | - | Ouv. |
| 101.1200 | 101.1300 | 101.1400 | 101.1900 | - | + Haut |
| 101.0800 | 101.1000 | 101.0900 | 101.0400 | - | + Bas |
| 101.0350 | 101.0420 | 101.0510 | 101.0570 | - | MM20 |
| 101.2260 | 101.2100 | 101.1940 | 101.1780 | - | MM50 |
| 101.4720 | 101.4680 | 101.4650 | 101.4610 | - | MM100 |
Produit
Trackers
Type de produit
-
Sous-jacent
Type de sous-jacent
-
Emetteur
-
Portefeuille Trading
+336.50 % vs +67.43 % pour le CAC 40
Performance depuis le 28 mai 2008