chiffres clés
Ouverture :
30.340 €
Perf Ouverture :
+2.44 %
+ Haut :
31.200 €
+ Bas :
30.180 €
Clôture veille :
30.320 €
Volume :
142 267
Capi échangé :
+0.33 %
Capi :
1 343 M€
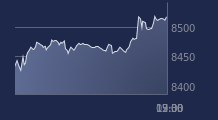
Graphique IPSOS sur 5 jours
Cours IPSOS sur 5 jours
| 17/02 | 18/02 | 19/02 | 20/02 | 23/02 | Date |
|---|---|---|---|---|---|
| 30.000(c) | 30.160(c) | 30.320(c) | 31.080(c) | - | Dernier |
| +1.01 % | +0.53 % | +0.53 % | +2.51 % | - | Var. |
| 110 819 | 108 551 | 63 451 | 142 267 | - | Volume |
| 29.400 | 30.000 | 30.020 | 30.340 | - | Ouv. |
| 30.140 | 30.360 | 30.440 | 31.200 | - | + Haut |
| 29.100 | 29.780 | 29.980 | 30.180 | - | + Bas |
| 33.613 | 33.473 | 33.232 | 33.015 | - | MM20 |
| 33.574 | 33.538 | 33.504 | 33.477 | - | MM50 |
| 33.720 | 33.658 | 33.585 | 33.517 | - | MM100 |
Performances historiques IPSOS
| 5 jours | 1 mois | 1er janvier | 5 ans |
|---|---|---|---|
| +0.32 % | -5.47 % | -9.28 % | +5.53 % |
Court terme
Baissière
Moyen terme
Baissière
Long terme
Baissière
Portefeuille Trading
+335.80 % vs +71.30 % pour le CAC 40
Performance depuis le 28 mai 2008


