


chiffres clés
Ouverture :
2.230 €
Perf Ouverture :
0.00 %
+ Haut :
2.230 €
+ Bas :
2.230 €
Clôture veille :
2.230 €
Volume :
1
Capi échangé :
+0.00 %
Capi :
7 M€
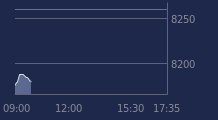
Graphique INNELEC MULTIMEDIA sur 5 jours
Cours INNELEC MULTIMEDIA sur 5 jours
| 07/04 | 08/04 | 09/04 | 10/04 | 13/04 | Date |
|---|---|---|---|---|---|
| 2.200(c) | 2.190(c) | 2.200(c) | 2.230(c) | 2.230 | Dernier |
| +0.92 % | -0.45 % | +0.46 % | +1.36 % | 0.00 % | Var. |
| 1 017 | 1 245 | 928 | 2 206 | 1 | Volume |
| 2.170 | 2.200 | 2.180 | 2.200 | 2.230 | Ouv. |
| 2.220 | 2.260 | 2.200 | 2.240 | 2.230 | + Haut |
| 2.170 | 2.170 | 2.180 | 2.170 | 2.230 | + Bas |
| 2.415 | 2.393 | 2.370 | 2.350 | 2.329 | MM20 |
| 2.739 | 2.719 | 2.699 | 2.680 | 2.661 | MM50 |
| 2.948 | 2.935 | 2.923 | 2.912 | 2.901 | MM100 |
Performances historiques INNELEC MULTIMEDIA
| 5 jours | 1 mois | 1er janvier | 5 ans |
|---|---|---|---|
| +2.29 % | -15.53 % | -25.91 % | -70.58 % |
Court terme
Baissière
Moyen terme
Baissière
Long terme
Baissière
Pas de conseil sur cette valeur
Portefeuille Trading
+332.70 % vs +64.48 % pour le CAC 40
Performance depuis le 28 mai 2008