


chiffres clés
Ouverture :
45.6350 €
+ Haut :
45.8750 €
+ Bas :
45.6350 €
Perf Ouverture :
+0.53 %
Clôture veille :
45.4000 €
Volume :
162
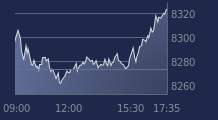
Graphique HSBC MSCIJAPAN ETF sur 5 jours
Cours HSBC MSCIJAPAN ETF sur 5 jours
| 04/02 | 05/02 | 06/02 | 09/02 | 10/02 | Date |
|---|---|---|---|---|---|
| 44.9450(c) | 44.0700(c) | 45.4000(c) | 45.8750(c) | - | Dernier |
| +1.87 % | -1.95 % | +3.02 % | +1.05 % | - | Var. |
| 44.2600 | 44.0850 | 44.6700 | 45.6350 | - | Ouv. |
| 44.9450 | 44.0850 | 45.4000 | 45.8750 | - | + Haut |
| 44.2100 | 44.0400 | 44.6700 | 45.6350 | - | + Bas |
| 43.8845 | 43.9378 | 43.9935 | 44.0703 | - | MM20 |
| 42.6482 | 42.7078 | 42.7959 | 42.8807 | - | MM50 |
| 41.8636 | 41.9005 | 41.9520 | 42.0100 | - | MM100 |
Produit
Trackers
Type de produit
Countries
Sous-jacent
MSCI JAPAN
Type de sous-jacent
-
Emetteur
HSBC GLOBAL ASSET MANAGEMENT (UK) LIMITED
Portefeuille Trading
+336.50 % vs +67.43 % pour le CAC 40
Performance depuis le 28 mai 2008