


chiffres clés
Ouverture :
34.600 €
Perf Ouverture :
-0.14 %
+ Haut :
34.650 €
+ Bas :
34.550 €
Clôture veille :
34.650 €
Volume :
6 378
Capi échangé :
+0.02 %
Capi :
1 026 M€
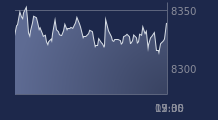
Graphique FNAC DARTY sur 5 jours
Cours FNAC DARTY sur 5 jours
| 07/07 | 08/07 | 09/07 | 10/07 | 13/07 | Date |
|---|---|---|---|---|---|
| 34.650(c) | 34.600(c) | 34.650(c) | 34.550(c) | - | Dernier |
| +0.29 % | -0.14 % | +0.14 % | -0.29 % | - | Var. |
| 7 778 | 3 436 | 7 135 | 6 378 | - | Volume |
| 34.550 | 34.500 | 34.600 | 34.600 | - | Ouv. |
| 34.650 | 34.650 | 34.650 | 34.650 | - | + Haut |
| 34.500 | 34.500 | 34.550 | 34.550 | - | + Bas |
| 34.543 | 34.545 | 34.550 | 34.550 | - | MM20 |
| 34.907 | 34.893 | 34.880 | 34.865 | - | MM50 |
| 35.081 | 35.073 | 35.065 | 35.056 | - | MM100 |
Performances historiques FNAC DARTY
| 5 jours | 1 mois | 1er janvier | 5 ans |
|---|---|---|---|
| 0.00 % | 0.00 % | +19.34 % | -36.66 % |
Court terme
Neutre
Moyen terme
Neutre
Long terme
Baissière
Portefeuille Trading
+319.20 % vs +67.75 % pour le CAC 40
Performance depuis le 28 mai 2008