


chiffres clés
Ouverture :
64.160 €
Perf Ouverture :
0.00 %
+ Haut :
64.900 €
+ Bas :
63.920 €
Clôture veille :
64.000 €
Volume :
253 289
Capi échangé :
+0.14 %
Capi :
11 292 M€
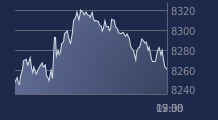
Graphique EUROFINS SCIENT. sur 5 jours
Cours EUROFINS SCIENT. sur 5 jours
| 02/04 | 07/04 | 08/04 | 09/04 | 10/04 | Date |
|---|---|---|---|---|---|
| 66.900(c) | 65.040(c) | 65.300(c) | 64.000(c) | 64.160(c) | Dernier |
| +2.83 % | -2.78 % | +0.40 % | -1.99 % | +0.25 % | Var. |
| 347 576 | 311 220 | 356 368 | 275 710 | 253 289 | Volume |
| 65.300 | 66.920 | 67.780 | 65.680 | 64.160 | Ouv. |
| 66.900 | 67.420 | 68.300 | 65.680 | 64.900 | + Haut |
| 64.880 | 65.040 | 65.160 | 63.040 | 63.920 | + Bas |
| 62.602 | 62.625 | 62.714 | 62.731 | 62.780 | MM20 |
| 65.481 | 65.368 | 65.256 | 65.112 | 64.982 | MM50 |
| 63.975 | 64.038 | 64.097 | 64.142 | 64.194 | MM100 |
Performances historiques EUROFINS SCIENT.
| 5 jours | 1 mois | 1er janvier | 5 ans |
|---|---|---|---|
| -4.10 % | +1.01 % | +2.82 % | -25.69 % |
Court terme
Haussière
Moyen terme
Neutre
Long terme
Neutre
Portefeuille Trading
+332.70 % vs +66.15 % pour le CAC 40
Performance depuis le 28 mai 2008