


chiffres clés
Ouverture :
13.620 €
Perf Ouverture :
+5.73 %
+ Haut :
14.580 €
+ Bas :
13.610 €
Clôture veille :
13.650 €
Volume :
320 980
Capi échangé :
+0.20 %
Capi :
2 325 M€
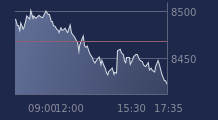
Graphique EMEIS (ex-ORPEA) sur 5 jours
Cours EMEIS (ex-ORPEA) sur 5 jours
| 15/06 | 16/06 | 17/06 | 18/06 | 19/06 | Date |
|---|---|---|---|---|---|
| 13.730(c) | 13.640(c) | 13.690(c) | 13.650(c) | 14.400(c) | Dernier |
| -3.11 % | -0.66 % | +0.37 % | -0.29 % | +5.49 % | Var. |
| 325 471 | 186 564 | 124 236 | 207 487 | 320 980 | Volume |
| 14.420 | 13.710 | 13.670 | 13.700 | 13.620 | Ouv. |
| 14.500 | 13.840 | 13.690 | 13.800 | 14.580 | + Haut |
| 13.710 | 13.600 | 13.530 | 13.450 | 13.610 | + Bas |
| 14.450 | 14.404 | 14.352 | 14.302 | 14.287 | MM20 |
| 14.391 | 14.390 | 14.382 | 14.354 | 14.365 | MM50 |
| 14.236 | 14.233 | 14.233 | 14.230 | 14.230 | MM100 |
Performances historiques EMEIS (ex-ORPEA)
| 5 jours | 1 mois | 1er janvier | 5 ans |
|---|---|---|---|
| +1.62 % | -2.31 % | +0.49 % | -99.79 % |
Court terme
Baissière
Moyen terme
Baissière
Long terme
Baissière
Pas de conseil sur cette valeur
Portefeuille Trading
+325.00 % vs +69.40 % pour le CAC 40
Performance depuis le 28 mai 2008