


chiffres clés
Ouverture :
14.700 €
Perf Ouverture :
+1.36 %
+ Haut :
14.950 €
+ Bas :
14.700 €
Clôture veille :
14.710 €
Volume :
153 222
Capi échangé :
+0.10 %
Capi :
2 238 M€
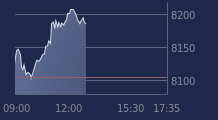
Graphique COFACE sur 5 jours
Cours COFACE sur 5 jours
| 26/02 | 27/02 | 02/03 | 03/03 | 04/03 | Date |
|---|---|---|---|---|---|
| 15.780(c) | 15.660(c) | 15.130(c) | 14.710(c) | 14.900 | Dernier |
| +0.38 % | -0.76 % | -3.38 % | -2.78 % | +1.29 % | Var. |
| 211 822 | 306 858 | 421 934 | 403 842 | 153 222 | Volume |
| 15.680 | 15.750 | 15.180 | 15.100 | 14.700 | Ouv. |
| 15.810 | 15.800 | 15.340 | 15.100 | 14.950 | + Haut |
| 15.480 | 15.650 | 15.000 | 14.640 | 14.700 | + Bas |
| 15.879 | 15.891 | 15.863 | 15.811 | 15.753 | MM20 |
| 15.692 | 15.697 | 15.689 | 15.674 | 15.661 | MM50 |
| 15.432 | 15.428 | 15.418 | 15.403 | 15.392 | MM100 |
Performances historiques COFACE
| 5 jours | 1 mois | 1er janvier | 5 ans |
|---|---|---|---|
| -5.22 % | -5.40 % | -5.10 % | +59.19 % |
Court terme
Baissière
Moyen terme
Baissière
Long terme
Baissière
Portefeuille Trading
+332.40 % vs +64.74 % pour le CAC 40
Performance depuis le 28 mai 2008