


chiffres clés
Ouverture :
21.880 €
Perf Ouverture :
+1.05 %
+ Haut :
22.310 €
+ Bas :
21.660 €
Clôture veille :
21.880 €
Volume :
875 245
Capi échangé :
+0.37 %
Capi :
5 188 M€
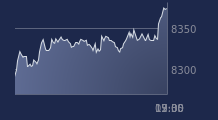
Graphique VALLOUREC sur 5 jours
Cours VALLOUREC sur 5 jours
| 20/07 | 21/07 | 22/07 | 23/07 | 24/07 | Date |
|---|---|---|---|---|---|
| 21.170(c) | 21.110(c) | 21.570(c) | 21.880(c) | 22.110(c) | Dernier |
| +2.12 % | -0.28 % | +2.18 % | +1.44 % | +1.05 % | Var. |
| 848 120 | 835 233 | 1 017 580 | 1 047 560 | 875 245 | Volume |
| 21.010 | 21.300 | 21.240 | 21.700 | 21.880 | Ouv. |
| 21.170 | 21.330 | 21.680 | 22.020 | 22.310 | + Haut |
| 20.860 | 20.740 | 21.230 | 21.600 | 21.660 | + Bas |
| 20.759 | 20.703 | 20.707 | 20.746 | 20.831 | MM20 |
| 22.878 | 22.820 | 22.713 | 22.604 | 22.513 | MM50 |
| 22.428 | 22.440 | 22.458 | 22.482 | 22.511 | MM100 |
Performances historiques VALLOUREC
| 5 jours | 1 mois | 1er janvier | 5 ans |
|---|---|---|---|
| +6.66 % | -0.54 % | +40.92 % | +184.19 % |
Court terme
Haussière
Moyen terme
Neutre
Long terme
Neutre
Portefeuille Trading
+317.20 % vs +68.42 % pour le CAC 40
Performance depuis le 28 mai 2008