


chiffres clés
Ouverture :
0.324 €
Perf Ouverture :
-2.78 %
+ Haut :
0.324 €
+ Bas :
0.313 €
Clôture veille :
0.324 €
Volume :
688
Capi échangé :
+0.00 %
Capi :
14 M€
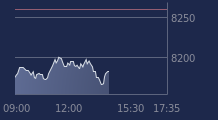
Graphique CELYAD sur 5 jours
Cours CELYAD sur 5 jours
| 07/04 | 08/04 | 09/04 | 10/04 | 13/04 | Date |
|---|---|---|---|---|---|
| 0.328(c) | 0.316(c) | 0.315(c) | 0.324(c) | 0.315 | Dernier |
| +2.50 % | -3.66 % | -0.32 % | +2.86 % | -2.78 % | Var. |
| 19 979 | 14 225 | 11 381 | 28 833 | 688 | Volume |
| 0.330 | 0.313 | 0.316 | 0.313 | 0.324 | Ouv. |
| 0.330 | 0.328 | 0.324 | 0.324 | 0.324 | + Haut |
| 0.313 | 0.313 | 0.313 | 0.313 | 0.313 | + Bas |
| 0.322 | 0.321 | 0.321 | 0.321 | 0.321 | MM20 |
| 0.308 | 0.311 | 0.313 | 0.316 | 0.319 | MM50 |
| 0.247 | 0.248 | 0.249 | 0.250 | 0.251 | MM100 |
Performances historiques CELYAD
| 5 jours | 1 mois | 1er janvier | 5 ans |
|---|---|---|---|
| -1.56 % | -0.94 % | +85.29 % | -94.84 % |
Court terme
Haussière
Moyen terme
Haussière
Long terme
Haussière
Pas de conseil sur cette valeur
Portefeuille Trading
+332.70 % vs +64.55 % pour le CAC 40
Performance depuis le 28 mai 2008