


chiffres clés
Ouverture :
2.390 €
Perf Ouverture :
-0.42 %
+ Haut :
2.400 €
+ Bas :
2.380 €
Clôture veille :
2.380 €
Volume :
11 601
Capi échangé :
+0.04 %
Capi :
73 M€
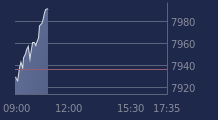
Graphique CATANA GROUP sur 5 jours
Cours CATANA GROUP sur 5 jours
| 11/03 | 12/03 | 13/03 | 16/03 | 17/03 | Date |
|---|---|---|---|---|---|
| 2.580(c) | 2.600(c) | 2.450(c) | 2.380(c) | 2.380 | Dernier |
| +0.78 % | +0.78 % | -5.77 % | -2.86 % | 0.00 % | Var. |
| 25 518 | 20 646 | 113 012 | 46 568 | 11 601 | Volume |
| 2.550 | 2.575 | 2.580 | 2.450 | 2.390 | Ouv. |
| 2.580 | 2.610 | 2.580 | 2.450 | 2.400 | + Haut |
| 2.525 | 2.540 | 2.330 | 2.380 | 2.380 | + Bas |
| 2.674 | 2.661 | 2.646 | 2.628 | 2.610 | MM20 |
| 2.773 | 2.766 | 2.757 | 2.748 | 2.739 | MM50 |
| 2.835 | 2.829 | 2.821 | 2.814 | 2.807 | MM100 |
Performances historiques CATANA GROUP
| 5 jours | 1 mois | 1er janvier | 5 ans |
|---|---|---|---|
| -7.03 % | -13.14 % | -19.05 % | -32.58 % |
Court terme
Baissière
Moyen terme
Baissière
Long terme
Baissière
Portefeuille Trading
+334.90 % vs +60.66 % pour le CAC 40
Performance depuis le 28 mai 2008