


chiffres clés
Ouverture :
60.550 €
Perf Ouverture :
+1.40 %
+ Haut :
61.800 €
+ Bas :
60.500 €
Clôture veille :
60.100 €
Volume :
18 693
Capi échangé :
+0.02 %
Capi :
4 670 M€
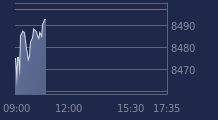
Graphique ARKEMA sur 5 jours
Cours ARKEMA sur 5 jours
| 18/02 | 19/02 | 20/02 | 23/02 | 24/02 | Date |
|---|---|---|---|---|---|
| 61.450(c) | 60.000(c) | 60.450(c) | 60.100(c) | 61.400 | Dernier |
| -1.76 % | -2.36 % | +0.75 % | -0.58 % | +2.16 % | Var. |
| 313 223 | 213 264 | 200 794 | 193 820 | 18 366 | Volume |
| 62.200 | 61.250 | 60.400 | 60.450 | 60.550 | Ouv. |
| 62.200 | 61.300 | 61.650 | 60.500 | 61.800 | + Haut |
| 59.500 | 60.000 | 60.000 | 59.350 | 60.500 | + Bas |
| 57.153 | 57.553 | 57.970 | 58.380 | 58.915 | MM20 |
| 53.927 | 54.120 | 54.319 | 54.504 | 54.668 | MM50 |
| 52.829 | 52.886 | 52.954 | 53.018 | 53.094 | MM100 |
Performances historiques ARKEMA
| 5 jours | 1 mois | 1er janvier | 5 ans |
|---|---|---|---|
| -1.84 % | +17.85 % | +17.74 % | -30.65 % |
Court terme
Haussière
Moyen terme
Haussière
Long terme
Haussière
Portefeuille Trading
+335.50 % vs +70.87 % pour le CAC 40
Performance depuis le 28 mai 2008