


chiffres clés
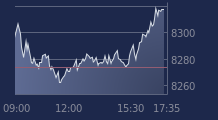
Ouverture :
86.6100 €
+ Haut :
86.8900 €
+ Bas :
86.2200 €
Perf Ouverture :
-0.45 %
Clôture veille :
87.4100 €
Volume :
41
Cours AMUNDI ETF GSCI AG sur 5 jours
| 03/02 | 04/02 | 05/02 | 06/02 | 09/02 | Date |
|---|---|---|---|---|---|
| - | - | - | - | - | Dernier |
| - | - | - | - | - | Var. |
| - | - | - | - | - | Ouv. |
| - | - | - | - | - | + Haut |
| - | - | - | - | - | + Bas |
| - | - | - | - | - | MM20 |
| - | - | - | - | - | MM50 |
| - | - | - | - | - | MM100 |
Produit
Trackers
Type de produit
Agriculture
Sous-jacent
S&P GSCI AGRICUL…
Type de sous-jacent
-
Emetteur
AMUNDI INVESTMENT SOLUTIONS
Portefeuille Trading
+336.70 % vs +67.34 % pour le CAC 40
Performance depuis le 28 mai 2008