


chiffres clés
Ouverture :
2.880 €
Perf Ouverture :
0.00 %
+ Haut :
2.900 €
+ Bas :
2.855 €
Clôture veille :
2.850 €
Volume :
21 266
Capi échangé :
+0.05 %
Capi :
112 M€
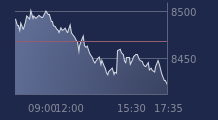
Graphique AFYREN sur 5 jours
Cours AFYREN sur 5 jours
| 15/06 | 16/06 | 17/06 | 18/06 | 19/06 | Date |
|---|---|---|---|---|---|
| 2.435(c) | 2.900(c) | 2.880(c) | 2.850(c) | 2.880(c) | Dernier |
| +0.62 % | +19.10 % | -0.69 % | -1.04 % | +1.05 % | Var. |
| 10 293 | 116 782 | 34 021 | 25 955 | 21 266 | Volume |
| 2.500 | 2.570 | 2.850 | 2.890 | 2.880 | Ouv. |
| 2.500 | 2.900 | 2.895 | 2.890 | 2.900 | + Haut |
| 2.430 | 2.570 | 2.805 | 2.800 | 2.855 | + Bas |
| 2.553 | 2.563 | 2.578 | 2.589 | 2.603 | MM20 |
| 2.480 | 2.486 | 2.492 | 2.498 | 2.504 | MM50 |
| 2.696 | 2.695 | 2.694 | 2.693 | 2.692 | MM100 |
Performances historiques AFYREN
| 5 jours | 1 mois | 1er janvier | 5 ans |
|---|---|---|---|
| +19.01 % | +11.20 % | +2.86 % | 0.00 % |
Court terme
Haussière
Moyen terme
Haussière
Long terme
Neutre
Pas de conseil sur cette valeur
Portefeuille Trading
+324.10 % vs +69.40 % pour le CAC 40
Performance depuis le 28 mai 2008