


chiffres clés
Ouverture :
7.860 €
Perf Ouverture :
-3.82 %
+ Haut :
7.860 €
+ Bas :
7.520 €
Clôture veille :
7.840 €
Volume :
6 313
Capi échangé :
+0.08 %
Capi :
63 M€
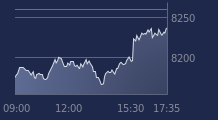
Graphique ABEO sur 5 jours
Cours ABEO sur 5 jours
| 07/04 | 08/04 | 09/04 | 10/04 | 13/04 | Date |
|---|---|---|---|---|---|
| 7.960(c) | 7.900(c) | 7.760(c) | 7.840(c) | 7.560(c) | Dernier |
| -1.24 % | -0.75 % | -1.77 % | +1.03 % | -3.57 % | Var. |
| 4 943 | 3 478 | 1 518 | 2 644 | 6 313 | Volume |
| 8.060 | 7.980 | 7.880 | 7.760 | 7.860 | Ouv. |
| 8.060 | 8.040 | 7.880 | 7.900 | 7.860 | + Haut |
| 7.760 | 7.900 | 7.760 | 7.700 | 7.520 | + Bas |
| 8.308 | 8.270 | 8.224 | 8.179 | 8.134 | MM20 |
| 8.587 | 8.569 | 8.547 | 8.528 | 8.503 | MM50 |
| 8.663 | 8.656 | 8.649 | 8.644 | 8.634 | MM100 |
Performances historiques ABEO
| 5 jours | 1 mois | 1er janvier | 5 ans |
|---|---|---|---|
| -6.20 % | -10.64 % | -16.19 % | -45.22 % |
Court terme
Baissière
Moyen terme
Baissière
Long terme
Baissière
Pas de conseil sur cette valeur
Portefeuille Trading
+332.70 % vs +65.68 % pour le CAC 40
Performance depuis le 28 mai 2008