


chiffres clés
Ouverture :
81.300 €
Perf Ouverture :
-2.09 %
+ Haut :
81.500 €
+ Bas :
78.850 €
Clôture veille :
81.300 €
Volume :
64 822
Capi échangé :
+0.15 %
Capi :
3 410 M€
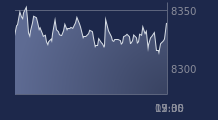
Graphique WENDEL sur 5 jours
Cours WENDEL sur 5 jours
| 06/07 | 07/07 | 08/07 | 09/07 | 10/07 | Date |
|---|---|---|---|---|---|
| 82.500(c) | 82.350(c) | 80.750(c) | 81.300(c) | 79.600(c) | Dernier |
| -0.78 % | -0.18 % | -1.94 % | +0.68 % | -2.09 % | Var. |
| 53 733 | 25 051 | 24 054 | 50 269 | 64 822 | Volume |
| 83.200 | 82.650 | 81.900 | 81.000 | 81.300 | Ouv. |
| 83.800 | 83.300 | 82.050 | 81.550 | 81.500 | + Haut |
| 81.550 | 82.350 | 80.550 | 80.550 | 78.850 | + Bas |
| 83.015 | 82.995 | 82.858 | 82.778 | 82.555 | MM20 |
| 85.078 | 85.048 | 84.984 | 84.949 | 84.853 | MM50 |
| 83.967 | 83.901 | 83.816 | 83.756 | 83.654 | MM100 |
Performances historiques WENDEL
| 5 jours | 1 mois | 1er janvier | 5 ans |
|---|---|---|---|
| -4.27 % | -3.81 % | -3.16 % | -27.44 % |
Court terme
Baissière
Moyen terme
Baissière
Long terme
Baissière
Portefeuille Trading
+319.20 % vs +67.75 % pour le CAC 40
Performance depuis le 28 mai 2008