


chiffres clés
Ouverture :
37.300 €
Perf Ouverture :
+0.56 %
+ Haut :
37.600 €
+ Bas :
37.230 €
Clôture veille :
37.220 €
Volume :
1 605 470
Capi échangé :
+0.22 %
Capi :
27 851 M€
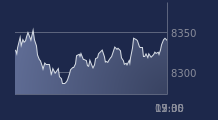
Graphique VEOLIA ENVIRON. sur 5 jours
Cours VEOLIA ENVIRON. sur 5 jours
| 13/07 | 14/07 | 15/07 | 16/07 | 17/07 | Date |
|---|---|---|---|---|---|
| 36.950(c) | 37.460(c) | 37.520(c) | 37.220(c) | 37.510(c) | Dernier |
| +1.85 % | +1.38 % | +0.16 % | -0.80 % | +0.78 % | Var. |
| 1 806 560 | 1 333 080 | 1 404 000 | 1 259 660 | 1 605 470 | Volume |
| 36.230 | 36.970 | 37.380 | 37.390 | 37.300 | Ouv. |
| 36.950 | 37.660 | 37.610 | 37.460 | 37.600 | + Haut |
| 36.230 | 36.900 | 37.300 | 36.760 | 37.230 | + Bas |
| 36.334 | 36.413 | 36.493 | 36.557 | 36.628 | MM20 |
| 35.433 | 35.469 | 35.495 | 35.522 | 35.555 | MM50 |
| 34.693 | 34.726 | 34.757 | 34.784 | 34.808 | MM100 |
Performances historiques VEOLIA ENVIRON.
| 5 jours | 1 mois | 1er janvier | 5 ans |
|---|---|---|---|
| +3.39 % | +4.54 % | +26.21 % | +43.83 % |
Court terme
Haussière
Moyen terme
Haussière
Long terme
Haussière
Portefeuille Trading
+318.20 % vs +67.75 % pour le CAC 40
Performance depuis le 28 mai 2008