


chiffres clés
Ouverture :
121.400 €
Perf Ouverture :
+3.13 %
+ Haut :
125.200 €
+ Bas :
120.800 €
Clôture veille :
122.000 €
Volume :
1 491
Capi échangé :
+0.01 %
Capi :
1 609 M€
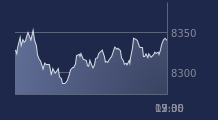
Graphique STEF sur 5 jours
Cours STEF sur 5 jours
| 13/07 | 14/07 | 15/07 | 16/07 | 17/07 | Date |
|---|---|---|---|---|---|
| 120.400(c) | 122.000(c) | 121.800(c) | 122.000(c) | 125.200(c) | Dernier |
| -2.11 % | +1.33 % | -0.16 % | +0.16 % | +2.62 % | Var. |
| 2 589 | 1 050 | 946 | 1 118 | 1 491 | Volume |
| 122.000 | 121.600 | 122.000 | 121.400 | 121.400 | Ouv. |
| 123.400 | 122.000 | 122.000 | 122.400 | 125.200 | + Haut |
| 120.400 | 119.400 | 119.600 | 121.000 | 120.800 | + Bas |
| 119.290 | 119.460 | 119.610 | 119.880 | 120.190 | MM20 |
| 118.280 | 118.416 | 118.504 | 118.608 | 118.772 | MM50 |
| 118.864 | 118.828 | 118.780 | 118.736 | 118.746 | MM100 |
Performances historiques STEF
| 5 jours | 1 mois | 1er janvier | 5 ans |
|---|---|---|---|
| +1.79 % | +5.56 % | -4.72 % | +38.34 % |
Court terme
Haussière
Moyen terme
Haussière
Long terme
Haussière
Portefeuille Trading
+318.20 % vs +67.75 % pour le CAC 40
Performance depuis le 28 mai 2008