


chiffres clés
Ouverture :
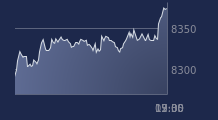
113.050 €
Perf Ouverture :
+1.95 %
+ Haut :
118.550 €
+ Bas :
112.000 €
Clôture veille :
116.800 €
Volume :
396 923
Capi échangé :
+1.11 %
Capi :
4 123 M€
Graphique SOITEC sur 5 jours
Cours SOITEC sur 5 jours
| 20/07 | 21/07 | 22/07 | 23/07 | 24/07 | Date |
|---|---|---|---|---|---|
| 86.400(c) | 95.480(c) | 96.020(c) | 116.800(c) | 115.250(c) | Dernier |
| -1.08 % | +10.51 % | +0.57 % | +21.64 % | -1.33 % | Var. |
| 383 755 | 305 274 | 292 712 | 967 520 | 396 923 | Volume |
| 87.140 | 88.880 | 92.140 | 120.000 | 113.050 | Ouv. |
| 87.960 | 95.720 | 97.480 | 128.000 | 118.550 | + Haut |
| 82.760 | 88.420 | 91.440 | 113.400 | 112.000 | + Bas |
| 105.539 | 104.293 | 103.729 | 103.956 | 104.001 | MM20 |
| 131.543 | 130.559 | 129.362 | 128.660 | 128.004 | MM50 |
| 104.263 | 104.796 | 105.347 | 106.085 | 106.817 | MM100 |
Performances historiques SOITEC
| 5 jours | 1 mois | 1er janvier | 5 ans |
|---|---|---|---|
| +31.96 % | -4.28 % | +396.98 % | -42.43 % |
Court terme
Haussière
Moyen terme
Neutre
Long terme
Neutre
Portefeuille Trading
+317.20 % vs +68.42 % pour le CAC 40
Performance depuis le 28 mai 2008